![]()

M. Impallomeni, F. Palusci, C. Petruzzi, E. Daneluzzo, D. Gianfelice, A. Rossi - Vol. 7, Dicembre 2001, num.4
Testo Immagini Bibliografia Summary Riassunto Indice
Disturbo di panico, qualità
della vita e assetto temperamentale in persone in trattamento con sertralina
Panic disorder, quality of life among people
with sertraline treatment
Tab. I. Caratteristiche socio-anagrafiche e cliniche
(n. 52). Socio-anagraphic and clinic characteristics of studied sample.
|
Sesso (M/F) |
|
19/43 |
|
Età (anni) |
media (DS) |
30,1 (7,8) |
|
Scolarità (anni) |
media (DS) |
10,7 (4,3) |
|
Tollerabilità |
|
|
|
Drop-outs |
% (n) |
16 (10/62)# |
|
Gastralgia |
% (n) |
15 (8/52) |
|
D. sfera sessuale |
% (n) |
19 (10/52) |
|
Comorbidità |
|
|
|
D. dellumore |
% (n) |
61 (38/62)# |
|
D. dansia |
% (n) |
29 (18/62)# |
|
D. uso sostanze |
% (n) |
5 (3/62)# |
|
Altri disturbi |
% (n) |
16 (10/62)# |
I drop-outs sono valutati sul campione iniziale; # = i dati
si riferiscono al campione iniziale di 62 pazienti.
Drop-outs are evaluated on initial sample; # = data are referred to initial
sample of 62 patients.
Tab. II. Punteggi (media (DS) delle scale dellSCL90 prima del trattamento (t0) e al follow-up (t1). Scores (mean (SD) of SCL90 scales before treatment (t0) and at follow up (t1).
|
(n = 52) |
t0 |
DS |
t1 |
DS |
D (t0-t1) |
DS |
D%t0-t1 |
t(51) |
p |
|
Somatizzazione |
1,8 |
0,9 |
1,1 |
0,8 |
0,72 |
0,8 |
40,0 |
6,3 |
,001 |
|
Ossessioni/ |
1,5 |
0,8 |
0,9 |
0,7 |
0,58 |
0,6 |
38,7 |
6,6 |
,001 |
|
Sensibilità Interpersonale |
1,1 |
0,8 |
0,6 |
0,6 |
0,53 |
0,7 |
48,2 |
5,4 |
,001 |
|
Depressione |
1,8 |
0,9 |
1,0 |
0,8 |
0,83 |
0,8 |
46,1 |
7,7 |
,001 |
|
Ansia |
1,8 |
0,8 |
0,9 |
0,7 |
0,90 |
0,7 |
50,0 |
8,6 |
,001 |
|
Rabbia |
0,9 |
0,7 |
0,4 |
0,5 |
0,54 |
0,7 |
60,0 |
5,2 |
,001 |
|
Fobia |
1,6 |
1,1 |
0,8 |
0,7 |
0,76 |
0,8 |
47,5 |
7,0 |
,001 |
|
Psicoticismo |
1,0 |
0,6 |
0,6 |
0,6 |
0,38 |
0,6 |
38,0 |
4,4 |
,001 |
|
Paranoia |
1,2 |
0,9 |
0,7 |
0,7 |
0,60 |
0,7 |
50,0 |
5,7 |
,001 |
|
Tot |
1,5 |
0,7 |
0,8 |
0,6 |
0,67 |
0,6 |
44,7 |
8,0 |
,001 |
Tab. III. Punteggi espressi in percentuale delle
scale dellSF36. Scores of SF36 scales, expressed as percentages.
|
(n = 52) |
t0 |
DS |
t1 |
DS |
D (t0-t1) |
DS |
t(51) |
p < |
|
Attività fisica |
59,7 |
26,8 |
73,3 |
23,2 |
-13,6 |
15,0 |
-6,5 |
,001 |
|
Ruolo e salute fisica |
20,1 |
32,8 |
44,1 |
43,2 |
-24,0 |
40,3 |
-4,3 |
,001 |
|
Dolore fisico |
46,4 |
24,7 |
62,7 |
26,2 |
-16,2 |
23,7 |
-4,9 |
,001 |
|
Salute in generale |
46,0 |
13,7 |
54,4 |
13,9 |
-8,4 |
11,4 |
-5,2 |
,001 |
|
Dimensione salute fisica |
43,0 |
18,1 |
59,3 |
22,7 |
-16,3 |
16,7 |
-7,02 |
,001 |
|
Vitalità |
32,4 |
21,8 |
54,2 |
26,3 |
-21,8 |
22,7 |
-6,8 |
,001 |
|
Attività sociali |
45,8 |
24,7 |
64,4 |
25,9 |
-18,7 |
22,3 |
-6,0 |
,001 |
|
Ruolo e stato emotivo |
30,7 |
33,9 |
58,8 |
36,9 |
-28,1 |
41,8 |
-4,8 |
,001 |
|
Salute mentale |
39,1 |
22,0 |
62,5 |
25,6 |
-23,4 |
19,8 |
-8,4 |
,001 |
|
Dimensione salute mentale |
37,0 |
20,9 |
60,7 |
24,5 |
-23,8 |
21,5 |
-7,97 |
,001 |
Tab. IV. Punteggi grezzi (media (DS) delle
dimensioni del TPQ al baseline (t0) e al follow up (t1). Raw scores (mean
(SD) of TPQ dimensions at baseline (t0) and at follow up (t1).
|
Dimensioni TPQ (n = 52) |
t0 |
DS |
t1 |
DS |
D(t0-t1) |
DS |
t |
p |
|
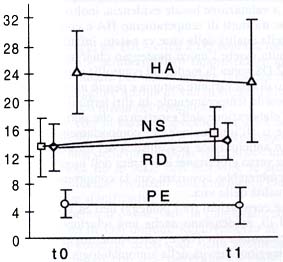
novelty seeking |
13,4 |
4,2 |
15,2 |
3,7 |
- 1,79 |
3,0 |
- 4,28* |
,001 |
|
reward dependence |
13,4 |
3,5 |
14,1 |
2,6 |
- 0,72 |
3,4 |
- 1,52 |
NS |
|
persistence |
5,1 |
2,1 |
4,6 |
1,7 |
0,49 |
2,5 |
1,41 |
NS |
|
harm avoidance |
24,2 |
5,9 |
22,8 |
8,9 |
1,42 |
5,4 |
1,89 |
,064 |
* Dopo correzione di Bonferroni p < ,05. After Bonferroni correction p < ,05.
Fig. 1. Variazioni dei punteggi (media (DS) delle dimensioni del TPQ al baseline (t0) e al follow up (t1). Scores changes (mean (SD) of TPQ dimensions at baseline (t0) and at follow up (t1).
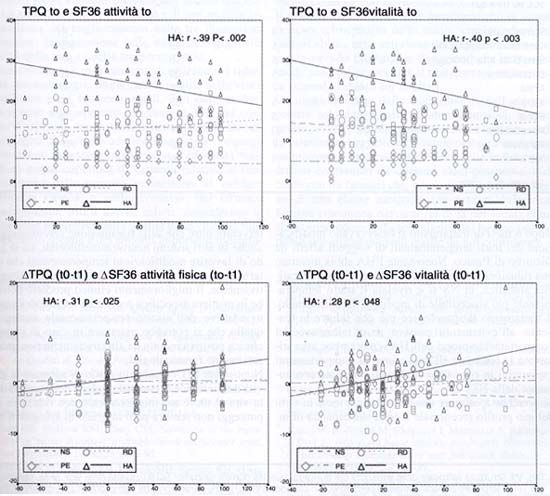
Tab. V. Correlazioni, r di Pearson, tra i punteggi dellSF36 ed i punteggi del TPQ al t0. Correlations, Pearsons r, between SF36 scores and TPQ scores at baseline (t0).
|
SF 36 (n = 52) |
NS |
RD |
PE |
HA |
|
Attività fisica |
,01 |
,26 |
- ,14 |
-,39** |
|
Ruolo e salute fisica |
,01 |
,03 |
- ,20 |
- ,26 |
|
Dolore fisico |
- ,08 |
- ,03 |
- ,11 |
- ,20 |
|
Salute in generale |
- ,35* |
- ,03 |
- ,02 |
- ,45** |
|
Dimensione salute fisica |
- ,09 |
,09 |
,18 |
- ,41* |
|
Vitalità |
- ,09 |
,11 |
,05 |
- ,40* |
|
Attività sociali |
- ,04 |
,17 |
,16 |
- ,39** |
|
Ruolo e stato emotivo |
,14 |
,13 |
- ,01 |
- ,38* |
|
Salute mentale |
- ,11 |
,17 |
- ,07 |
- ,43** |
|
Dimensione salute mentale |
- ,01 |
,18 |
,04 |
- ,48** |
*: p < ,05; **: p < ,001.
Fig. 2. Correlazioni (r di Pearson) fra tratti temperamentali in ordinata e punteggi dellSF36 in ascissa dellattività fisica e della vitalità al t0 nelle figure in alto, e tra le variazioni (t0-t1) nelle figure in basso. Correlations (Pearsons r) between temperamental traits (y axis) and SF36 scores (x axis): physical activity and vitality at baseline on the top; and changes respect to baseline [D(t0-t1)] of physical activity and vitality scores at the bottom.
Tab. VI. Correlazioni tra i punteggi dellSCL90 e le dimensioni temperamentali al baseline (t0). Correlations between SCL90 scores and TPQ scores at baseline (t0).
|
SCL 90 (n = 52) |
NS |
RD |
PE |
HA |
|
Somatizzazione |
,17 |
- ,04 |
- ,07 |
,38* |
|
Ossessioni /compulsioni |
- ,05 |
- ,23 |
- ,12 |
,43** |
|
Sensibilità interpersonale |
,12 |
- ,06 |
,06 |
,67** |
|
Depressione |
,16 |
- ,03 |
- ,09 |
,58** |
|
Ansia |
,16 |
- ,07 |
- ,01 |
,37* |
|
Rabbia |
,36* |
,06 |
,08 |
,46** |
|
Fobia |
,09 |
,06 |
- ,12 |
,38* |
|
Psicoticismo |
,29* |
- ,10 |
- ,11 |
,40* |
|
Paranoia |
,17 |
- ,17 |
,02 |
,47** |
|
Tot |
,18 |
- ,08 |
- ,06 |
,57** |
*: p < ,05; **: p < ,001.
Tab. VII. Struttura fattoriale delle variazioni dei punteggi (D) nei tre domini (sintomo: SCL90, qualità della vita: SF36, personalità: TPQ). Structure of Factor Analysis performed on changes scores (D) in the three domains (symptom: SCL90, quality of life: SF36, personality: TPQ).
|
|
Fattore 1 |
Fattore 2 |
Fattore 3 |
|
D(t0-t1)SCL90 somatizzazione |
,89 |
|
|
|
D(t0-t1)SCL90 depressione |
,87 |
|
|
|
D(t0-t1)SCL90 ansia |
,89 |
|
|
|
D(t0-t1)SCL90 fobia |
,81 |
|
|
|
D(t0-t1)SF36 dimensione salute fisica |
|
,79 |
|
|
D(t0-t1)SF36 dimensione salute mentale |
|
,74 |
|
|
D(t0-t1)TPQ NS |
|
|
-,80 |
|
D(t0-t1)TPQ RD |
|
|
,67 |
|
D(t0-t1)TPQ PE |
|
|
,73 |
|
D(t0-t1)TPQ HA |
|
-,66 |
|
|
Eigenvalue |
3,7 |
1,7 |
1,3 |
|
% varianza spiegata |
37,0 |
16,7 |
13,3 |
Sono riportati in tabella solo le correlazioni con i fattori
con peso > ,50.
Reported only scores > ,50.