![]()

S. Marenco, D.R. Weinberger - Vol. 9, March 2003, Issue 1
Testo Immagini Bibliografia Summary Indice
Evolution of molecular targets for antipsychotic
therapy
Evoluzione dei siti dazione molecolari per il trattamento delle psicosi
Fig. 1. Timeline of antipsychotic development.
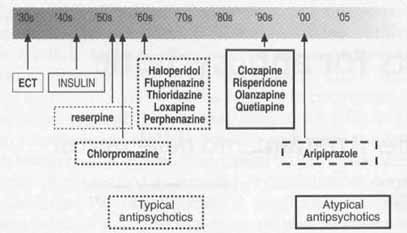
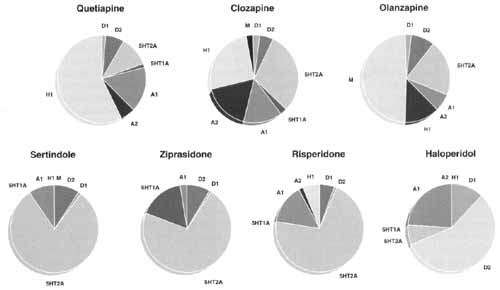
Fig. 2. Comparative receptor binding profile of the atypical antipsychotics. The total occupancy exerted on all receptors is the total area of each pie chart and each sector represents the relative amount of binding to each receptor subtype.
Tab. I. Kd of several atypical antipsychotics for various subtypes of receptors. Lower numbers represent higher affinity.
|
Receptor |
Aripiprazole |
Olanzapine |
Risperidone |
Ziprasidone |
Quetiapine |
Clozapine |
Haloperidol |
|
D1 |
265 |
31 |
430 |
525 |
455 |
85 |
210 |
|
D2 |
0,45 |
11 |
4 |
5 |
160 |
126 |
0,7 |
|
D3 |
0,8 |
49 |
10 |
7 |
340 |
473 |
2 |
|
D4 |
44 |
27 |
9 |
32 |
1600 |
35 |
3 |
|
5HT1a |
4,4 |
> 10000 |
210 |
3 |
2800 |
875 |
1100 |
|
5HT2a |
3,4 |
4 |
0,5 |
0,4 |
295 |
16 |
45 |
|
5HT2c |
15 |
23 |
25 |
1 |
1500 |
16 |
> 10000 |
|
_1 |
57 |
19 |
0,7 |
10 |
7 |
7 |
6 |
|
H1 |
61 |
7 |
20 |
47 |
11 |
6 |
440 |
|
M1 |
> 10000 |
1,9 |
> 10000 |
> 1000 |
120 |
1,9 |
> 1500 |
| Based on: (61) (62) | |||||||
.