![]()

G. La Malfa, L. Mosconi, A. Ragazzoni, L. Rossi - Vol. 8, March 2002, Issue 1
Testo Immagini Bibliografia Summary Indice
Potenziali Evocati Evento-Correlati (P300) nel Disturbo
da Attacchi di Panico: una prospettiva cognitiva
Event-Related Potentials (P300) abnormalities in Panic Disorder: a
cognitive point of view
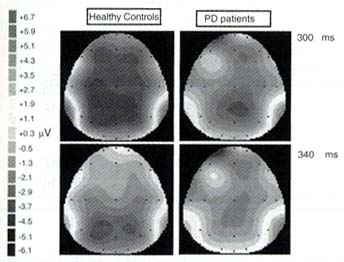
Fig. 1. Mappe topografiche di propagazione del potenziale elettrico corrispondenti ad un tempo di latenza di 300 e 340 msec: confronto tra gruppo di controllo (N = 8) e gruppo DAP (N = 8) nella modalità fast (ISI = 500 msec). La scala di colorazione delle mappe in funzione del valore di ampiezza degli ERPs è riportata nel lato sinistro della figura. Al lato destro delle scansioni è riportato il tempo di latenza corrispondente. Grand-averaged topographical brain maps obtained at a latency of 300 msec and 340 msec, from the control group (N = 8) and the PD group (N = 8), during the fast modality condition (ISI = 500 msec). Voltage values are shown on the left side and latency values on the right side of the figure.
Tab. I. Ampiezza e latenza media della P300 in risposta a stimoli target, rilevate dagli elettrodi Fz, Cz, Pz, T3 e T4. Gruppo di controllo, N = 8; Gruppo DAP, N = 8; sono riportate le medie e le deviazioni standard a fianco tra parentesi. Mean Amplitude and Latency of P300 ERP at Fz, Cz, Pz, T3, and T4 to Target Tones. Controls, N = 8; PD patients, N = 8; values are mean (SD).
|
Amplitude (mV) |
||||||
|
Standard condition |
Group |
Fz |
Cz |
Pz |
T3 |
T4 |
|
Control |
4,5 (2,2) |
4,8 (1,3) |
7,4 (2,1) |
4,5 (1,6) |
3,9 (0,9) |
|
|
PD |
5,7 (2,2) |
5,6 (2,9) |
5,1 (1,9) |
3,1 (1,6) |
3,8 (1,1) |
|
|
Fast condition |
||||||
|
Control |
4,3 (2,6) |
5,6 (2,6) |
5,4 (2,5) |
3,2 (1,1) |
3,5 (1,8) |
|
|
PD |
4,1 (0,9) |
5,1 (2,4) |
3,7 (1,1) |
2,6 (1,4) |
4,1 (0,9) |
|
|
Latency (msec) |
||||||
|
Standard condition |
Group |
Fz |
Cz |
Pz |
T3 |
T4 |
|
Control |
343 (15) |
344 (16) |
356 (12) |
371 (71) |
357 (34) |
|
|
PD |
307 (14) |
307 (19) |
308 (23) |
326 (53) |
314 (16) |
|
|
Fast condition |
||||||
|
Control |
334 (26) |
331 (25) |
340 (20) |
340 (27) |
345 (16) |
|
|
PD |
302 (10) |
302 (10) |
309 (11) |
327 (14) |
312 (14) |
|